


Tidyplots empowers life scientists with easy code-based data visualization
Posted on: 21 February 2025 , updated on: 24 February 2025
Preprint posted on 11 November 2024
Article now published in iMeta at http://dx.doi.org/10.1002/imt2.70018
Tired of complex code for data visualization? Tidyplots offers an intuitive R package for creating customizable plots with minimal programming knowledge.
Selected by Felipe Del Valle BatallaCategories: bioinformatics
Background:
Data visualization is essential for understanding and sharing experimental findings. Unfortunately, existing open-source tools often have complex syntax, posing a barrier for life scientists especially those not used to work with code. Traditional data analysis workflows can’t really cope with the increasing data volume and current reproducibility standards. Additionally, many scientists are not able to afford commercial licenses for more mainstream programs that take care of data analysis and visualization, which can sometimes lead to inadequate data assessing and analysis.
As described in the preprint highlighted here, ‘tidyplots’ addresses this by providing a user-friendly, code-based interface for creating plots. It aims to empower researchers by allowing them to use automated data visualization pipelines.
Key features of tidyplots:
Easy crafting of graphs
Tidyplots introduces a novel interface based on consistent and intuitive grammar that minimizes the need for extensive programming experience. The human-like syntax facilitates the creation of plots through a series of function calls connected in a pipeline, using verbs like “add,” “remove,” and “adjust”. (Fig 1.)
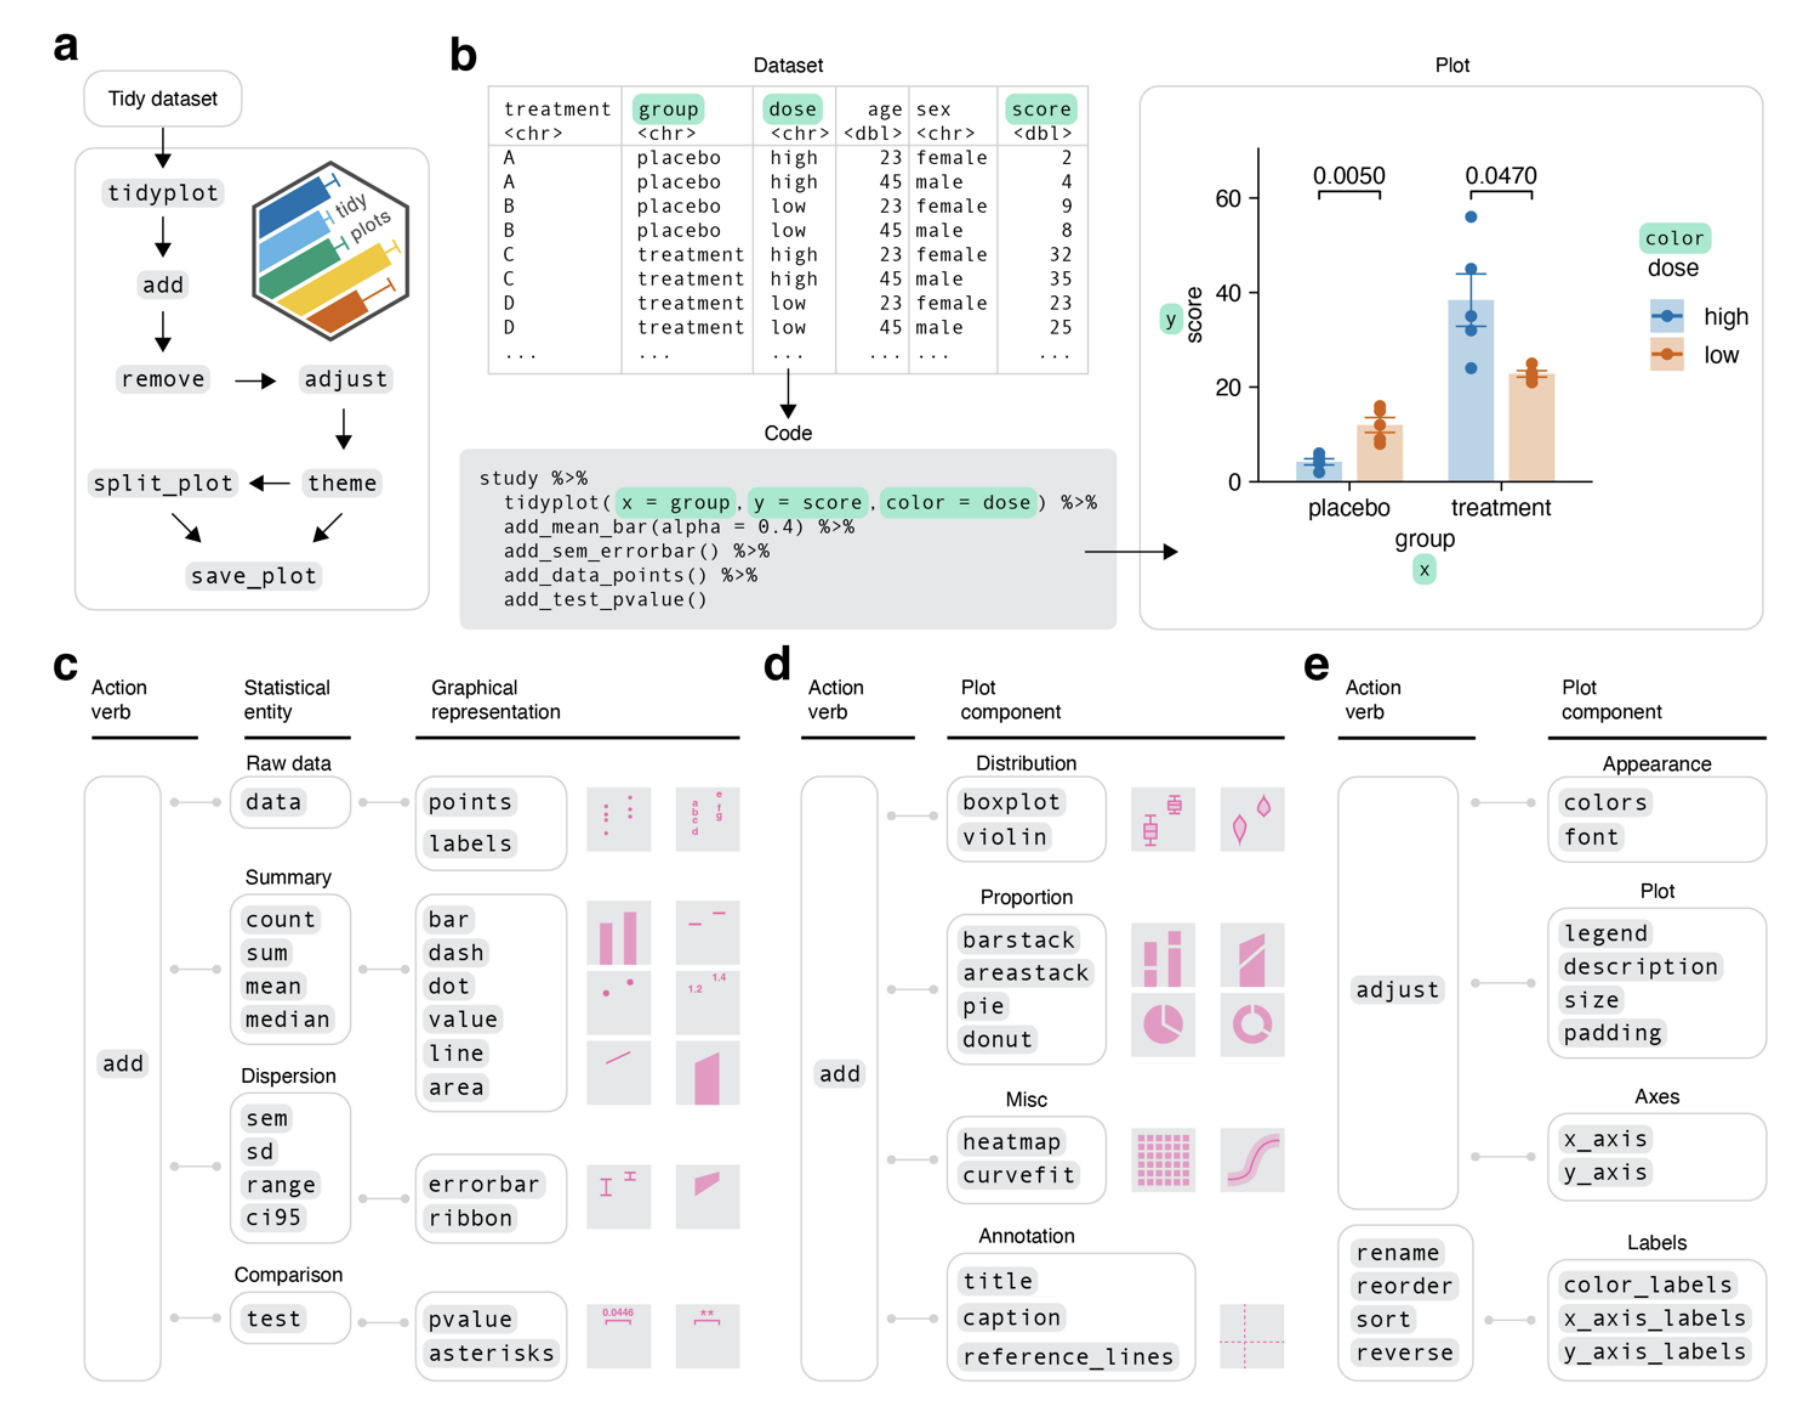
Fig.1 from the preprint. Illustrates the basic syntaxis and arguments for generating intuitive graphs and visualizations with tidyplots. Image is made available under a a CC-BY-ND 4.0 International license.
Code economy and visualization flexibility
The tidyplots R package requires less code compared to ggplot2 to achieve equivalent plots and thereby reduces code complexity. It offers over 50 add functions for plotting raw data, statistics, distributions, and annotations.
Tidyplots also provides demo datasets, color schemes for color vision deficiencies, and thorough documentation. Jan Broder Engler, the creator of tidyplots and author of this preprint, provides constant examples on its X account (https://x.com/JanBroderEngler) and one can find more use cases on the webpage of the project (https://tidyplots.org/). To hear directly from Jan, please check out the ‘spotLights’ episode above.
Why we (see spotLight above!) highlight this work:
Tidyplots focuses on human code readability, making the source code easier to read and write. We like that Tidyplots prioritizes specialized functions, which—combined with the consistent naming scheme and code editor auto-completion— eliminates the need to consult function documentation. This is important because it lowers the barrier to entry for scientists who may not have extensive programming experience, enabling them to create effective visualizations and improve reproducibility.
Future Directions and Questions:
Will tidyplots integrate with other data analysis tools and workflows commonly used in specific life science domains?
Could tidyplots be expanded to include interactive plotting capabilities for enhanced data exploration?
doi: https://doi.org/10.1242/prelights.39673
Read preprint (No Ratings Yet)
Sign up to customise the site to your preferences and to receive alerts
Register hereAlso in the bioinformatics category:
Remote homology and functional genetics unmask deeply preserved Scm3/HJURP orthologs in metazoans
Reinier Prosee
A potential anti-amyloidogenic therapy for type 2 diabetes based on the QBP1 peptide
Joao Gabriel, Marcus Oliveira
The lipidomic architecture of the mouse brain
CRM UoE Journal Club et al.
preLists in the bioinformatics category:
Keystone Symposium – Metabolic and Nutritional Control of Development and Cell Fate
This preList contains preprints discussed during the Metabolic and Nutritional Control of Development and Cell Fate Keystone Symposia. This conference was organized by Lydia Finley and Ralph J. DeBerardinis and held in the Wylie Center and Tupper Manor at Endicott College, Beverly, MA, United States from May 7th to 9th 2025. This meeting marked the first in-person gathering of leading researchers exploring how metabolism influences development, including processes like cell fate, tissue patterning, and organ function, through nutrient availability and metabolic regulation. By integrating modern metabolic tools with genetic and epidemiological insights across model organisms, this event highlighted key mechanisms and identified open questions to advance the emerging field of developmental metabolism.
| List by | Virginia Savy, Martin Estermann |
‘In preprints’ from Development 2022-2023
A list of the preprints featured in Development's 'In preprints' articles between 2022-2023
| List by | Alex Eve, Katherine Brown |
9th International Symposium on the Biology of Vertebrate Sex Determination
This preList contains preprints discussed during the 9th International Symposium on the Biology of Vertebrate Sex Determination. This conference was held in Kona, Hawaii from April 17th to 21st 2023.
| List by | Martin Estermann |
Alumni picks – preLights 5th Birthday
This preList contains preprints that were picked and highlighted by preLights Alumni - an initiative that was set up to mark preLights 5th birthday. More entries will follow throughout February and March 2023.
| List by | Sergio Menchero et al. |
Fibroblasts
The advances in fibroblast biology preList explores the recent discoveries and preprints of the fibroblast world. Get ready to immerse yourself with this list created for fibroblasts aficionados and lovers, and beyond. Here, my goal is to include preprints of fibroblast biology, heterogeneity, fate, extracellular matrix, behavior, topography, single-cell atlases, spatial transcriptomics, and their matrix!
| List by | Osvaldo Contreras |
Single Cell Biology 2020
A list of preprints mentioned at the Wellcome Genome Campus Single Cell Biology 2020 meeting.
| List by | Alex Eve |
Antimicrobials: Discovery, clinical use, and development of resistance
Preprints that describe the discovery of new antimicrobials and any improvements made regarding their clinical use. Includes preprints that detail the factors affecting antimicrobial selection and the development of antimicrobial resistance.
| List by | Zhang-He Goh |