


A data-driven Boolean model explains memory subsets and evolution in CD8+ T cell exhaustion
Posted on: 10 April 2023 , updated on: 21 August 2023
Preprint posted on 15 March 2023
Article now published in npj Syst Biol Appl at https://www.nature.com/articles/s41540-023-00297-2
Building upon a published mathematical model of T-cell exhaustion (Bolouri et al., 2020) to study the dynamics that give rise to CD8+ T-cell exhaustion.
Selected by Benjamin Dominik MaierCategories: systems biology
Updated 17 August 2023 with a postLight by Benjamin Dominik Maier
Congratulations to Geena V. Ildefonso and Stacey D. Finley! Their preprint has been published in npj systems biology and applications on July 31st 2023 (link to the article: https://www.nature.com/articles/s41540-023-00297-2).
Overall, there are no substantial differences between the peer-reviewed journal article and the preprint article. Addressing one of my questions raised in the preLight (Q1), the authors added four supplemental figures (S1-S4) showing the fractional activation profiles of PP and EE gene as well as the number of simulations that have not reached their terminal end state. Their results demonstrate that the variability between trajectories of cells within the same group was comparable with each other (for more details, see the author’s response to Q1). Additionally, the authors expanded upon the method section, restating essential assumptions and findings from the previous mathematical model by Bolouri et al., 2020. They also made some minor adjustments, such as clarifying the rationale behind inhibiting PD1 activation via NFATC1 and contextualizing it within the existing literature. As a result, the journal version stands as a more self-contained document, better accentuating Ildefonso and Finley’s hypotheses and original contributions.
Building upon the findings of this study, I am excited to see how it may help other researchers to prioritise which conditions are worth following up experimentally and aid in the refinement of future computational models to ultimately develop targeted therapies against T-cell exhaustion.
Background:
T-cell exhaustion
While antigen stimulation is required for the proliferation and differentiation of naïve T-cells, a chronic stimulation leads to a stepwise and progressive loss of T-cell functions called T-cell exhaustion (TCE). This T-cell dysfunction occurs in chronic infections or cancer and is caused by a failure to clear antigens which leads to a prolonged exposure of T-cells to antigens. This chronic activation of T-cells results in the upregulation of inhibitory receptors like PD-1 suppressing T-cell activation and proliferation. Due to the inhibition, they become dysfunctional, losing their ability to produce (enough) cytokines and killing infected or cancerous cells.
Understanding of CD8+ T-cell differentiation and TCE
Recent advances allowed researchers to identify the key transcription factors responsible for CD8+ T-cell differentiation (Wherry et al., 2015; Seo et al., 2021) and led to the development of two models of TCE (Henning et al., 2018; Chen et al., 2018). According to the linear model, a gradual change in the transcriptional profile regulated by different signal strengths and durations results in a linear progression towards terminally differentiated CD8+ T-cells, white the circular model assumes that there are (multiple) oscillatory changes in the gene expression before T-cells reach their terminal state.
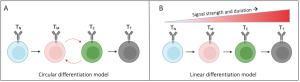
Figure 1: Proposed CD8+ T cell differentiation models result in unique gene expression patterns over time. (A) In the circular model of CD8+ T cell differentiation, naïve T cells (TN) cycle between memory (TM) and exhausted (TE) intermediates before reaching a terminal differentiated state (TT). (B) In the linear model, CD8+ T cells differentiate depending on the gradual acquisition of memory- or exhausted-associated genes. Figure and caption taken from Ildefonso & Finley (2023) bioRXiv, which was published under a Attribution-NoDerivatives 4.0 International License (CC BY-ND 4.0).
Due to the limited mechanistic understanding of the gene regulatory networks causing TCE, it is not yet possible to therapeutically prevent or reverse TCE. Additionally, Abdel-Hakeem et al. (2021) found that exhausted T-cells remain exhausted when they are no longer exposed to antigen stimulation suggesting that even after long-term remission from cancer, T-cells do not recover.
Literature derived, data-driven mathematical model of CD8+ T cell gene regulation
In this preprint, Ildefonso and Finley adapted a published Boolean model of TCE which was constructed using manual literature curation of key molecular interactions associated with TCE and public gene expression data of various states of T-cell differentiation (Bolouri et al., 2020). Using expression clustering and time course analysis, Bolouri and colleagues found that the expression of network genes can be used as a marker to classify genes as associated with effector function and irreversible exhaustion (EE) or the pro-memory and proliferative state (PP).
Boolean models
A boolean model is a type of mathematical model used to study complex systems. It uses a set of binary variables (True = 1, False = 0) and a set of logical rules (Boolean functions) that describe the interactions between the variables, to represent the state of the system. By updating the variable values according to these rules, the model can simulate the behaviour of the system over time. In comparison to rule-based and ordinary differential equation (ODE)-based mathematical models, logical Boolean models are simpler and more computationally efficient, making them ideal for studying large-scale biological networks with discrete variables and interactions. While ODE models predict system behaviour quantitatively, Boolean models are better suited for identifying key regulatory interactions and analysing system behaviour qualitatively.
Key Findings
Population-level dynamic show early activation of effector exhausted associated genes
Ildefonso and Finley investigated the dynamic interplay and the transcriptional changes during CD8+ T-cell differentiation and TCE. Therefore, they sampled 10,000 trajectories each representing a single cell from the model upon stimulation of the T-cell receptor and the interleukin network. When comparing the activation of EE and PP associated genes over time, they found that EE-associated genes exhibited a rapid-onset with an early peak dominating over PP-associated genes. Subsequently, more PP-genes were activated before both groups behaved similarly at low activation levels for the rest of the time course. The observation that cells reaching a terminal state early display high levels of EE-genes as opposed to PP-genes suggests that T-cell exhaustion may be caused by early transition events.
Identification of eight distinct end states of T-cell exhaustion
Next, the authors studied the different gene expression profiles and network structures regulating terminal T-cell differentiation resulting from the initial common set of network interactions. Clustering the terminal states revealed eight distinct networks with different combinations of PP and EE genes. Six of them were associated with T-cell exhaustion (99.9% of terminal cells), while two were associated with pro-memory T-cells (0.1%). Their respective transcriptional profiles were in line with previously described experimental observations.
Circular and linear model of differentiation
From each cluster, one trajectory (single cell) was extracted to study the changes of transcriptional profiles over time. Thus, the authors could determine which specific gene combinations result in the distinct terminal networks and whether their activation pattern follows the linear or the circular model. For five of the six exhausted T-cell profiles, an oscillatory pattern (circular model) between PP and EE states was observed before cells were reaching their terminal state. Both pro-memory state profiles as well as one T-cell exhaustion profile displayed a progressive gradual increase in gene expression suggesting that they follow the linear model.
NFATC1 repression of PD1 favours terminal pro-memory state
To study how the model behaves under perturbed conditions, the authors repressed a known activator of programmed cell death protein 1 (PD-1). PD-1 is a key receptor of T-cell exhaustion and a well-established cancer drug target. When simulating the model, the authors observed that the early dynamics of the cell population were mostly driven by high activation of memory-associated PP genes as opposed to EE genes earlier. Looking at long-term activation, low and similar activation profiles were again observed for both gene groups. Generally, cells took more time before reaching a terminal state and the majority of terminal states was characterised as pro-memory T-cells (54%) as compared to 0.1% for the wildtype. Moreover, the common modulators and the network architecture of the resulting terminal states were different compared to the wildtype ones. The two terminally exhausted states were caused by an alternative route allowing for PD-1 activation and a high expression of a tumour suppressor gene known to activate receptors inhibiting immune responses, respectively. With the exception of one pro-memory T-cell state, all perturbation profiles were following the circular model when studying individual trajectories.
Perspective
The developed model helps to better understand the two proposed models of T-cell exhaustion and the specific gene profiles driving their dynamics. The model can be used as a framework for hypothesis generation and to predict T-cell differentiation (dynamics and terminal states) for cells with altered gene regulatory networks to ultimately computationally test and predict potential therapeutic targets.
In the future, one could transform the model into a system of ordinary differential equations (ODE) to study the dynamics continuously and more quantitatively (see Wittmann et al., 2009). Some genes, signalling cascades and readouts which were not represented in the model might be added to capture the cross-talk and account for CD4+ and NK-cells modulating Cd8+ T-cell exhaustion (Waggoner et al., 2011). Finally, transforming the model into a weak background model (see classification from Froehlich et al., 2015) could help to better represent network rewiring.
What I liked about this preprint
When I first read the manuscript, I was surprised how much insight the authors were able to generate from a fairly small and simple boolean model (e.g. no cross-talk, just key gene regulatory interactions, …) and how well their results agree with known experimental observations. Nowadays, many scientists (including me) often aim for bigger, more detailed models of biological processes and we do not question enough whether this is needed or beneficial. It reminds me a lot of Occam’s razor, the principle of parsimony in philosophy, suggesting that the simplest explanation is usually the best one.
It is always delightful to see authors incorporate and adapt previously published models to answer their own research questions especially given that many mathematical models are not reproducible – sometimes not even for the respective authors (Tiwari et al., 2021) despite community standards (Hucka et al., 2003; Le Novère et al., 2006).
Moreover, as my PhD project aims at developing (whole-cell) context-specific executable models of signalling processes, it is always helpful to learn how other researchers approach similar questions and to draw inspiration from their methods.
References
Abdel-Hakeem, M. S., Manne, S., Beltra, J.-C., Stelekati, E., Chen, Z., Nzingha, K., Ali, M.-A., Johnson, J. L., Giles, J. R., Mathew, D., Greenplate, A. R., Vahedi, G., & Wherry, E. J. (2021). Epigenetic scarring of exhausted T cells hinders memory differentiation upon eliminating chronic antigenic stimulation. Nature Immunology, 22(8), 1008–1019. https://doi.org/10.1038/s41590-021-00975-5
Bolouri, H., Young, M., Beilke, J., Johnson, R., Fox, B., Huang, L., … Ratushny, A. (2020). Integrative network modeling reveals mechanisms underlying T cell exhaustion. Scientific Reports, 10(1), 1915. https://doi.org/10.1038/s41598-020-58600-8
Chen, Y., Zander, R., Khatun, A., Schauder, D. M., & Cui, W. (2018). Transcriptional and Epigenetic Regulation of Effector and Memory CD8 T Cell Differentiation. Frontiers in Immunology, 9. https://doi.org/10.3389/fimmu.2018.02826
Cornberg, M., Kenney, L., Chen, A., Kim, S.-K., Dienes, H., Waggoner, S., … Selin, L. (2013). Clonal Exhaustion as a Mechanism to Protect Against Severe Immunopathology and Death from an Overwhelming CD8 T Cell Response. Frontiers in Immunology, 4. https://doi.org/10.3389/fimmu.2013.00475
Fröhlich, H., Bahamondez, G., Götschel, F., & Korf, U. (2015). Dynamic Bayesian Network Modeling of the Interplay between EGFR and Hedgehog Signaling. PLOS ONE, 10(11), e0142646). https://doi.org/10.1371/journal.pone.0142646
He, X., & Xu, C. (2020). PD-1: A Driver or Passenger of T Cell Exhaustion? Molecular Cell, 77(5), 930–931. https://doi.org/10.1016/j.molcel.2020.02.013
Henning, A. N., Roychoudhuri, R., & Restifo, N. P. (2018). Epigenetic control of CD8+ T cell differentiation. Nature Reviews Immunology, 18(5), 340–356. https://doi.org/10.1038/nri.2017.146
Hucka, M., Finney, A., Sauro, H. M., Bolouri, H., Doyle, J. C., Kitano, H., … and the rest of the SBML Forum: (2003). The systems biology markup language (SBML): a medium for representation and exchange of biochemical network models. Bioinformatics, 19(4), 524–531. https://doi.org/10.1093/bioinformatics/btg015
Montacchiesi, G., & Pace, L. (2022). Epigenetics and CD8+ T cell memory*. Immunological Reviews, 305(1), 77–89. https://doi.org/10.1111/imr.13057
Le Novère, N., Bornstein, B., Broicher, A., Courtot, M., Donizelli, M., Dharuri, H., … Hucka, M. (2006). BioModels Database: a free, centralized database of curated, published, quantitative kinetic models of biochemical and cellular systems. Nucleic Acids Research, 34(Database issue), D689-91. https://doi.org/10.1093/nar/gkj092
Seo, W., Jerin, C., & Nishikawa, H. (2021). Transcriptional regulatory network for the establishment of CD8+ T cell exhaustion. Experimental & Molecular Medicine, 53(2), 202–209. https://doi.org/10.1038/s12276-021-00568-0
Tiwari, K., Kananathan, S., Roberts, M. G., Meyer, J. P., Sharif Shohan, M. U., Xavier, A., … Malik-Sheriff, R. S. (2021). Reproducibility in systems biology modelling. Molecular Systems Biology, 17(2), e9982. https://doi.org/10.15252/msb.20209982
Waggoner, S. N., Cornberg, M., Selin, L. K., & Welsh, R. M. (2011). Natural killer cells act as rheostats modulating antiviral T cells. Nature, 481(7381), 394–398). https://doi.org/10.1038/nature10624
Wherry, E. J., & Kurachi, M. (2015). Molecular and cellular insights into T cell exhaustion. Nature Reviews Immunology, 15(8), 486–499. https://doi.org/10.1038/nri3862
Wittmann, D. M., Krumsiek, J., Saez-Rodriguez, J., Lauffenburger, D. A., Klamt, S., & Theis, F. J. (2009). Transforming Boolean models to continuous models: methodology and application to T-cell receptor signaling. BMC Systems Biology, 3(1). https://doi.org/10.1186/1752-0509-3-98
doi: https://doi.org/10.1242/prelights.34264
Read preprint (No Ratings Yet)
Sign up to customise the site to your preferences and to receive alerts
Register hereAlso in the systems biology category:
Human single-cell atlas analysis reveals heterogeneous endothelial signaling
Charis Qi
Longitudinal single cell RNA-sequencing reveals evolution of micro- and macro-states in chronic myeloid leukemia
Charis Qi
Environmental and Maternal Imprints on Infant Gut Metabolic Programming
Siddharth Singh
preLists in the systems biology category:
2024 Hypothalamus GRC
This 2024 Hypothalamus GRC (Gordon Research Conference) preList offers an overview of cutting-edge research focused on the hypothalamus, a critical brain region involved in regulating homeostasis, behavior, and neuroendocrine functions. The studies included cover a range of topics, including neural circuits, molecular mechanisms, and the role of the hypothalamus in health and disease. This collection highlights some of the latest advances in understanding hypothalamic function, with potential implications for treating disorders such as obesity, stress, and metabolic diseases.
| List by | Nathalie Krauth |
‘In preprints’ from Development 2022-2023
A list of the preprints featured in Development's 'In preprints' articles between 2022-2023
| List by | Alex Eve, Katherine Brown |
EMBL Synthetic Morphogenesis: From Gene Circuits to Tissue Architecture (2021)
A list of preprints mentioned at the #EESmorphoG virtual meeting in 2021.
| List by | Alex Eve |
Single Cell Biology 2020
A list of preprints mentioned at the Wellcome Genome Campus Single Cell Biology 2020 meeting.
| List by | Alex Eve |
ASCB EMBO Annual Meeting 2019
A collection of preprints presented at the 2019 ASCB EMBO Meeting in Washington, DC (December 7-11)
| List by | Madhuja Samaddar et al. |
EMBL Seeing is Believing – Imaging the Molecular Processes of Life
Preprints discussed at the 2019 edition of Seeing is Believing, at EMBL Heidelberg from the 9th-12th October 2019
| List by | Dey Lab |
Pattern formation during development
The aim of this preList is to integrate results about the mechanisms that govern patterning during development, from genes implicated in the processes to theoritical models of pattern formation in nature.
| List by | Alexa Sadier |