


A novel metric reveals previously unrecognized distortion in dimensionality reduction of scRNA-Seq data
Posted on: 16 August 2019
Preprint posted on 2 July 2019
Your scRNA-seq analysis pipeline may be warping your data, due to dimensionality reduction.
Selected by Suraj KannanCategories: bioinformatics, genomics
What I like about this study:
I would like to highlight two aspects of this study. Firstly, the topic is simply critical to anyone who has ever analyzed scRNA-seq data (which is becoming increasingly ubiquitous in cellular biology). Dimensionality reduction is the first step in almost every algorithm and analysis pipeline, and a fundamental assumption is that this step preserves important (biologically-relevant) information from the original high-dimensional data. If in fact this step distorts the data, as the authors convincingly argue, biological conclusions from scRNA-seq data would need to be scrutinized. Secondly, this paper is exceptionally well-written. I appreciate that the authors use analogies and toy cases that are both illustrative and clear, even to those without a mathematics or statistical background.
Background
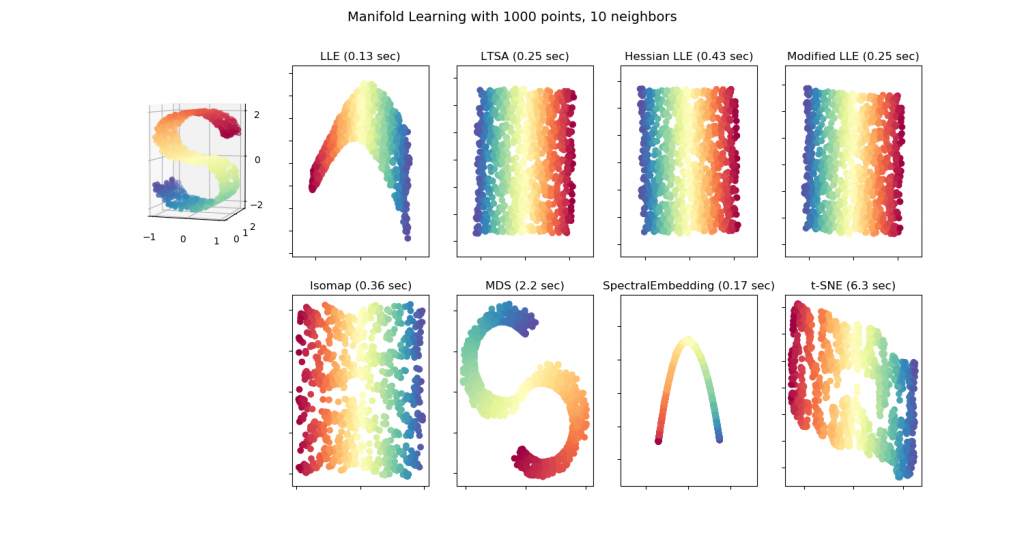
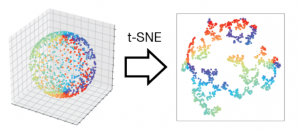
scRNA-seq data is inherently high dimensional, with increasingly sensitive methods capable of detecting thousands of genes per cell. Higher dimensional data, while providing potentially more information, is more difficult to analyze – many algorithms fail to scale up to higher dimensions, for example [1, 2]. A large number of methods exist to transform high dimensional data to low dimensional data while preserving key aspects of the structure (see below for a toy example on several methods) [3]. These methods, including the frequently used t-SNE and UMAP algorithms, underlie nearly all scRNA-seq analysis pipelines, including commonly used algorithms for clustering and trajectory analysis [1]. A fundamental assumption is that dimensionality reduction preserves important structure in the high dimensional data or, at the very worst, does not skew the structure significantly.
Key Findings
The authors challenge this assumption using several illustrative cases. As a toy geometrical example, the authors first generated hyperspheres (generalizations of spheres to higher dimensions). In a clever approach, the authors generated lower dimensional hyperspheres in higher dimensions. For example, they could construct a 3-dimensional hypersphere in 5 dimensions by taking a vector of 3 numbers (the 3-dimensional hypersphere) and adding on 2 zeros at the end to make it 5-dimensional. It is trivial to reduce the dimensions of this sphere to 3 or 4 dimensions, e.g. transform the point [1 1 1 0 0] → [1 1 1 0] (4-dimension) or [1 1 1 0 0] → [1 1 1] (3 dimensions). Thus, the authors expected that standard dimensionality reduction techniques should readily succeed in transforming these hyperspheres to lower dimensions, or at the very least preserve local neighbors between different points. Instead, the authors found that even in this simple toy case, all of the methods introduced huge distortions, such that most points had hugely different neighboring points in low dimensions as compared to high dimensions. Increasing the number of points sampled did not improve the mapping but in fact made it worse.
The authors then used their approach to analyze dimensionality reduction of real scRNA-seq data. Consistently, they found huge distortions in data even when reducing to relatively high dimensions. This is particularly problematic as most pipelines reduce data to 2 or 3 dimensions (as these are easily visualized). Indeed, the authors tested several commonly used pipelines for clustering and trajectory generation and found that they are affected by dimensionality reduction.
My thoughts
This manuscript affects any research group using scRNA-seq techniques. As an example, in developmental biology a common approach is to reconstruct developmental trajectories of various lineages to study how cells differentiate and specify. If dimensionality reduction inherently skews the data, then the results of these analyses are questionable.
There is no question that these results are disturbing, and motivate the need to develop improved scRNA-seq pipelines (either by developing better dimensionality reduction methods or eliminating their need). In the meantime, however, I do wonder if current techniques are good enough for now, particularly for clustering. While local neighborhoods may be distorted, tSNE and UMAP plots do places cells with similar gene expression close to one another – this can be readily seen by plotting marker genes, for example. Particularly for smaller studies or studies where differences between cell types is clearly defined, tSNE and UMAP may suffice despite the distortions they may introduce. Likewise, while clearly dimensionality reduction does affect cell-to-cell distances, current trajectory reconstruction methods do at least partially correlate with other biological parameters (for example, developmental age). While we should be cautious about interpretation, I suspect that computational methods combined with biological intuition can at least be passable until better methods are developed.
Citations
[1] Stegle O, Teichmann SA, Marioni JC. Computational and analytical challenges in single-cell transcriptomics. Nat Rev Genet (2015), 16(3):133-45.
[2] Friedman JH. On Bias, Variance, 0/1 – Loss, and the Curse-of-Dimensionality. Data Mining and Knowledge Discovery (1997), 1:55-77.
[3] Manifold Learning, scikit documentation. Link: https://scikit-learn.org/stable/modules/manifold.html
doi: https://doi.org/10.1242/prelights.13389
Read preprint (No Ratings Yet)
Sign up to customise the site to your preferences and to receive alerts
Register hereAlso in the bioinformatics category:
Temporal degradation of PRC2 uncovers specific developmental dependencies
María Mariner-Faulí
Science should be machine-readable
Theodora Stougiannou
Remote homology and functional genetics unmask deeply preserved Scm3/HJURP orthologs in metazoans
Reinier Prosee
Also in the genomics category:
Comprehensive Lineage Tracing Maps the Landscape of Cell Fate Decisions in Mouse Embryogenesis
Béryl Laplace-Builhé, Lucie Hermet
Combinatorial and Inducible CRISPRa/i Enables Canalized hiPSC Forward Programming and Iterative Refinement via Single-Cell Genomics
Cell-ID
Inhibition of the gut ceramidase Asah2 decelerates the vertebrate ageing rate
Jeny Jose
preLists in the bioinformatics category:
Keystone Symposium – Metabolic and Nutritional Control of Development and Cell Fate
This preList contains preprints discussed during the Metabolic and Nutritional Control of Development and Cell Fate Keystone Symposia. This conference was organized by Lydia Finley and Ralph J. DeBerardinis and held in the Wylie Center and Tupper Manor at Endicott College, Beverly, MA, United States from May 7th to 9th 2025. This meeting marked the first in-person gathering of leading researchers exploring how metabolism influences development, including processes like cell fate, tissue patterning, and organ function, through nutrient availability and metabolic regulation. By integrating modern metabolic tools with genetic and epidemiological insights across model organisms, this event highlighted key mechanisms and identified open questions to advance the emerging field of developmental metabolism.
| List by | Virginia Savy, Martin Estermann |
‘In preprints’ from Development 2022-2023
A list of the preprints featured in Development's 'In preprints' articles between 2022-2023
| List by | Alex Eve, Katherine Brown |
9th International Symposium on the Biology of Vertebrate Sex Determination
This preList contains preprints discussed during the 9th International Symposium on the Biology of Vertebrate Sex Determination. This conference was held in Kona, Hawaii from April 17th to 21st 2023.
| List by | Martin Estermann |
Alumni picks – preLights 5th Birthday
This preList contains preprints that were picked and highlighted by preLights Alumni - an initiative that was set up to mark preLights 5th birthday. More entries will follow throughout February and March 2023.
| List by | Sergio Menchero et al. |
Fibroblasts
The advances in fibroblast biology preList explores the recent discoveries and preprints of the fibroblast world. Get ready to immerse yourself with this list created for fibroblasts aficionados and lovers, and beyond. Here, my goal is to include preprints of fibroblast biology, heterogeneity, fate, extracellular matrix, behavior, topography, single-cell atlases, spatial transcriptomics, and their matrix!
| List by | Osvaldo Contreras |
Single Cell Biology 2020
A list of preprints mentioned at the Wellcome Genome Campus Single Cell Biology 2020 meeting.
| List by | Alex Eve |
Antimicrobials: Discovery, clinical use, and development of resistance
Preprints that describe the discovery of new antimicrobials and any improvements made regarding their clinical use. Includes preprints that detail the factors affecting antimicrobial selection and the development of antimicrobial resistance.
| List by | Zhang-He Goh |
Also in the genomics category:
BSDB Spring Meeting: Molecules to Morphogenesis
The British Society for Developmental Biology (BSDB) Spring Meeting Molecules to Morphogenesis was held from 23–26 March 2026 at the University of Warwick (UK). This meeting brought together a vibrant community of researchers to discuss how molecular mechanisms are integrated across scales to drive morphogenesis, spanning diverse model systems and approaches. This preList contains preprints by presenters from the talk and poster sessions at the meeting. Please do get in touch at preLights@biologists.com if you notice any relevant preprints that we may have missed.
| List by | Ingrid Tsang |
Keystone Symposium on Stem Cell Models in Embryology 2026
The Keystone Symposium on Stem Cell Models in Embryology, 2026, was organised by Jun Wu (UT Southwestern), Jianping Fu (University of Michigan) and Miki Ebisuya (TU Dresden) and held at Asilomar Conference Grounds in California (US). The meeting discussed recent advances made in establishing stem-cell-based embryo models, what fundamental insights into developmental processes have been gleaned from them, as well as how they are beginning to be applied more widely. This prelist contains preprints by presenters at the talk and poster sessions at the conference, which our Reviews Editor in attendance spotted. Please do reach out to preLights@biologists.com if you notice any that we’ve missed.
| List by | Ingrid Tsang |
November in preprints – DevBio & Stem cell biology
preLighters with expertise across developmental and stem cell biology have nominated a few developmental and stem cell biology (and related) preprints posted in November they’re excited about and explain in a single paragraph why. Concise preprint highlights, prepared by the preLighter community – a quick way to spot upcoming trends, new methods and fresh ideas.
| List by | Aline Grata et al. |
May in preprints – the CellBio edition
A group of preLighters, with expertise in different areas of cell biology, have worked together to create this preprint reading lists for researchers with an interest in cell biology. This month, categories include: 1) Biochemistry/metabolism 2) Cancer cell Biology 3) Cell adhesion, migration and cytoskeleton 4) Cell organelles and organisation 5) Cell signalling and 6) Genetics
| List by | Barbora Knotkova et al. |
March in preprints – the CellBio edition
A group of preLighters, with expertise in different areas of cell biology, have worked together to create this preprint reading lists for researchers with an interest in cell biology. This month, categories include: 1) cancer biology 2) cell migration 3) cell organelles and organisation 4) cell signalling and mechanosensing 5) genetics and genomics 6) other
| List by | Girish Kale et al. |
Biologists @ 100 conference preList
This preList aims to capture all preprints being discussed at the Biologists @100 conference in Liverpool, UK, either as part of the poster sessions or the (flash/short/full-length) talks.
| List by | Reinier Prosee, Jonathan Townson |
Early 2025 preprints – the genetics & genomics edition
In this community-driven preList, a group of preLighters, with expertise in different areas of genetics and genomics have worked together to create this preprint reading list. Categories include: 1) bioinformatics 2) epigenetics 3) gene regulation 4) genomics 5) transcriptomics
| List by | Chee Kiang Ewe et al. |
End-of-year preprints – the genetics & genomics edition
In this community-driven preList, a group of preLighters, with expertise in different areas of genetics and genomics have worked together to create this preprint reading list. Categories include: 1) genomics 2) bioinformatics 3) gene regulation 4) epigenetics
| List by | Chee Kiang Ewe et al. |
BSCB-Biochemical Society 2024 Cell Migration meeting
This preList features preprints that were discussed and presented during the BSCB-Biochemical Society 2024 Cell Migration meeting in Birmingham, UK in April 2024. Kindly put together by Sara Morais da Silva, Reviews Editor at Journal of Cell Science.
| List by | Reinier Prosee |
9th International Symposium on the Biology of Vertebrate Sex Determination
This preList contains preprints discussed during the 9th International Symposium on the Biology of Vertebrate Sex Determination. This conference was held in Kona, Hawaii from April 17th to 21st 2023.
| List by | Martin Estermann |
Semmelweis Symposium 2022: 40th anniversary of international medical education at Semmelweis University
This preList contains preprints discussed during the 'Semmelweis Symposium 2022' (7-9 November), organised around the 40th anniversary of international medical education at Semmelweis University covering a wide range of topics.
| List by | Nándor Lipták |
20th “Genetics Workshops in Hungary”, Szeged (25th, September)
In this annual conference, Hungarian geneticists, biochemists and biotechnologists presented their works. Link: http://group.szbk.u-szeged.hu/minikonf/archive/prg2021.pdf
| List by | Nándor Lipták |
EMBL Conference: From functional genomics to systems biology
Preprints presented at the virtual EMBL conference "from functional genomics and systems biology", 16-19 November 2020
| List by | Jesus Victorino |
TAGC 2020
Preprints recently presented at the virtual Allied Genetics Conference, April 22-26, 2020. #TAGC20
| List by | Maiko Kitaoka et al. |
Zebrafish immunology
A compilation of cutting-edge research that uses the zebrafish as a model system to elucidate novel immunological mechanisms in health and disease.
| List by | Shikha Nayar |