


Serial sarcomere number is substantially decreased within the paretic biceps brachii in individuals with chronic hemiparetic stroke
Posted on: 13 July 2020
Preprint posted on 5 May 2020
Article now published in Proceedings of the National Academy of Sciences at http://dx.doi.org/10.1073/pnas.2008597118
As the famous muscle building saying goes: “if you don’t use it, you lose it”. This is true at the smallest muscle level as Adkins and colleagues find a loss in serial sarcomere numbers of the biceps brachii on chronic hemiparetic stroke survivors.
Selected by Jonaz MorenoCategories: bioengineering
Background
About 80 percent of the 7 million stroke survivors in the USA suffer from substantial motor impairments which have a great impact on their ability to perform everyday tasks. Typically, there is neuronal damage that causes decreases in voluntary muscle control while increasing involuntary muscle control at the opposite side of the damage, leading to an inability to fully contract and relax the muscles. Consequently, chronic stroke survivors have an overall decrease in muscle use and a more flexed resting posture on the affected (paretic) side. Muscle architecture is crucial for muscle contraction and force generation. In particular, optimal fascicle length (OFL) and physiological cross-sectional area (PCSA) are two important muscle structures that can be calculated from other parameters like muscle volume, fascicle length, pennation angle and sarcomere length. Although there are previous studies that has reported differences in these muscle structures in children with cerebral palsy1,2, It is unclear whether serial sarcomere loss occurs in individuals with chronic hemiparetic stroke. The purpose of this study was to quantify sarcomere length, fascicle length, and muscle volume of the biceps brachii muscle on the paretic side and the non-paretic side of individuals with chronic hemiparetic stroke and in both arms of an age matched healthy population.
Key Findings
This study had three major instruments for data collection. The authors used a microendoscopy system to measure sarcomere length, using a second-harmonic generation optical technique to observe the muscle striation patterns of sarcomeres. This can capture an image of the A-band (myosin protein) of the sarcomeres which enables direct measurement of the sarcomeres. The fascicle length was measured using an extended field-of-view ultrasound. This involves moving the ultrasound probe along the length of the muscle and capturing sequential B-mode ultrasound images that can be put together into a full image of the whole muscle. For muscle volume, the authors used MRI on both upper limbs with the Dixon method and fat suppression. Eliminating the intramuscular fat content is necessary to prevent overestimation of the raw muscle volume. Illustration of all three instruments can be seen in Figure 1.
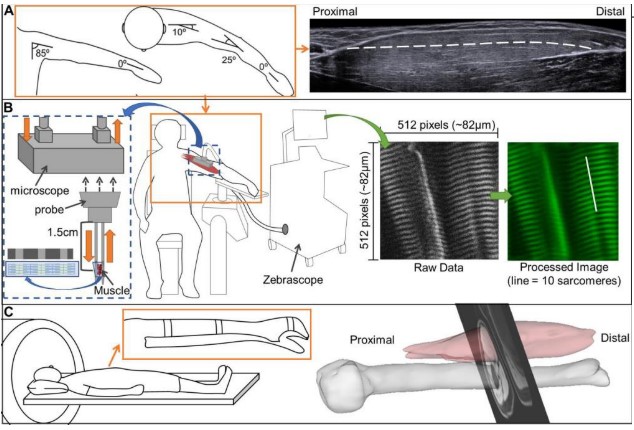
Figure 1. Illustration of experimental set up of muscle architecture measures. A) arm posture use for fascicle length (ultrasound, right image) and sarcomere length. B) illustration of the Zebrascope set up and the sarcomere image with processing on the far right (green image, white line = 1 sarcomere). C) Ultrasound set-up and 3D image reproduction using single MRI slice superimposed. Image taken from Adkins et al. 2020 preprint.
Serial sarcomere number, fascicle length, and sarcomere length
The number of serial sarcomeres were significantly lower on the paretic arm versus the non-paretic arm of the stroke patients (Figure 2). Further, fascicle length was also significantly lower on the paretic arm versus the non-paretic arm of the stroke patients (Figure 3A). Interestingly, there were no significant differences in sarcomere length between the paretic arm and non-paretic arm of stroke survivors (Figure 3B).
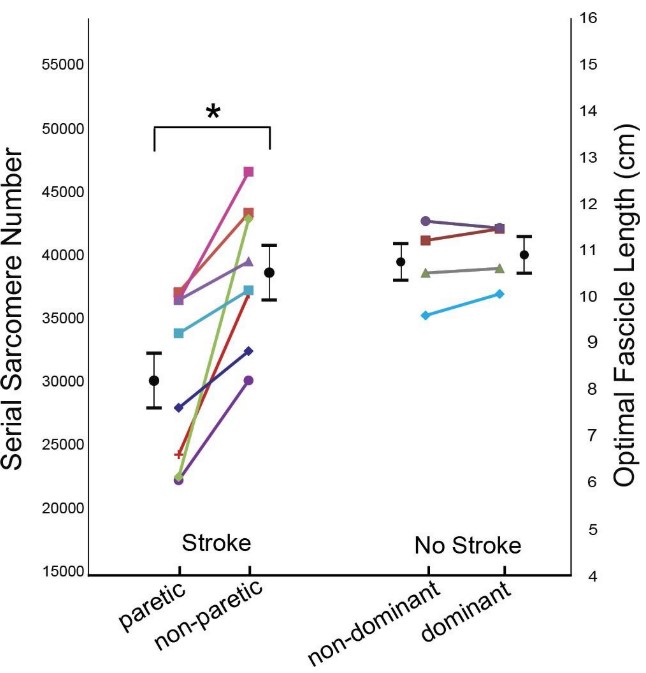
Figure 2: Serial Sarcomere Number/ Optimal Fascicle Length. The graph is showing the differences in serial sarcomere numbers and, proportionally, optimal fascicle length for the stroke patients (left side) and the healthy participants (No stroke, right side). Each participant corresponds to each color and shape. Black circular points and error bars represent the mean and standard deviations for each group. The star (*) indicates significant interlimb difference (p<0.05). Image taken from Adkins et al., 2020 preprint.
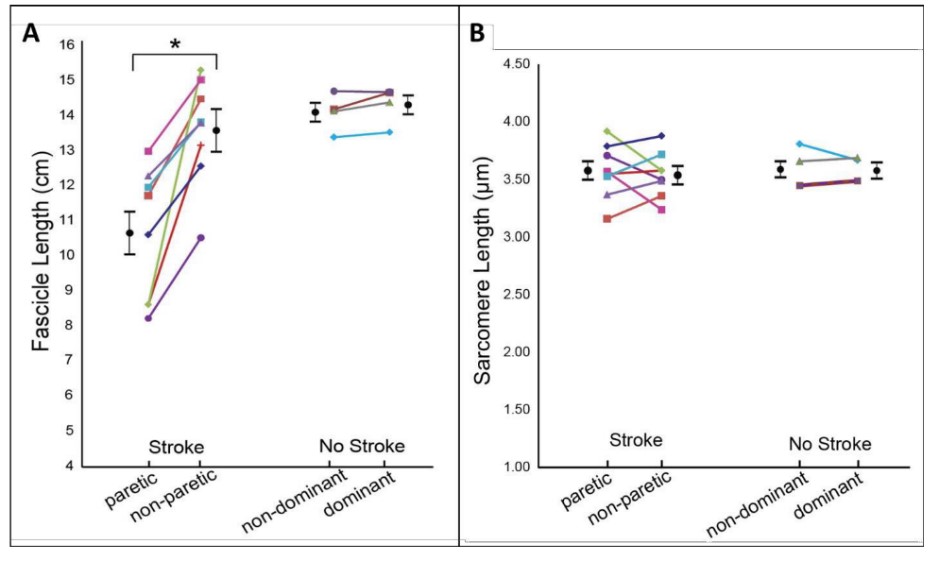
Figure 3: Fascicle and Sarcomere length: Graphs illustrating mean fascicle length (A) and mean sarcomere length (B) for the stroke patients (left side) and healthy patients (No stroke, right side). Each participant corresponds to each color and shape. Black circular points and error bars represent the mean and standard deviations for each group. The star (*) indicates significant interlimb difference (p<0.05). Image taken from Adkins et al., 2020 preprint.
PCSA and muscle volume
The results from this study showed significantly lower muscle volume on the paretic compared to the non-paretic arm of the stroke patients. There was a modest decreased in PCSA in the paretic compared to the non-paretic arm of the stroke patients.
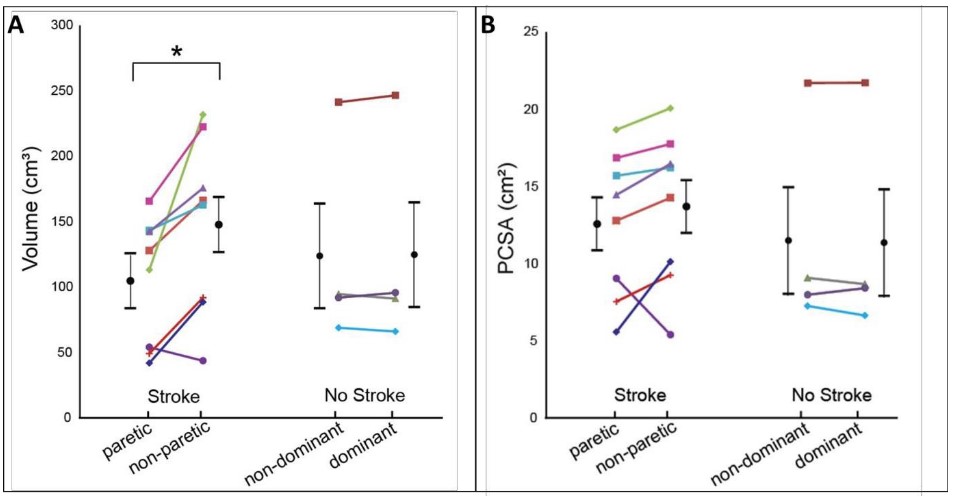
Figure 4: Muscle Volume and PSCA: Muscle volume was calculated with intramuscular fat removed (A). Physiological cross-sectional area (PCSA) was calculated as the ratio between muscle volume and optimal fascicle length (B). Each participant corresponds to each color and shape. Black circular points and error bars represent the mean and standard deviations for each group. The star (*) indicates significant interlimb difference (p<0.05). Image taken from Adkins et al., 2020 preprint.
Conclusion
Overall, this study was able to demonstrate changes in muscle structures in patients that have suffered from stroke and have lived with this condition for at least 5 years post-trauma. Although there were no changes in sarcomere length, the authors have reported smaller fascicle lengths and reduced serial sarcomere number on the paretic side in stroke survivors. This may be an indication that reduced muscle force production in the paretic side is because of changes in muscle architecture in addition to changes in neuronal drive.
What I liked about this preprint
Although the ability to quantify the number of serial sarcomeres is not something readily available, this study highlights the importance of possible changes in muscle structures that have not been previously considered. Changes in the nervous system may be associated with acute ones after suffering from stroke. However, the inability to continue using the paretic side can have big consequences on muscle architecture when stroke survivors have been forced to adapt their resting postures due to neuronal changes, thus limiting the amount of force generation on the paretic side.
Open Questions
- I did notice that the cohort you selected for this study is within the old age population group. I was wondering if you would expect a similar result on a group that may be younger.
- As a follow up question from number 1, if you expect similar results regardless of age groups, would you think physical therapy interventions can reduce the loss in serial sarcomere numbers?
- In your introduction and discussion sections you mentioned muscle structural changes in children with CP and how they sarcomere length was longer, you showed that for stroke survivors that had upper limb damage that is not the case. I was wondering if this could be because muscles of the leg (specially the soleus) is in constant interaction with the ground while walking. Therefore, there is an external stimulus into the muscle that is often not present in the upper body. Would you expect this to influence muscle architecture?
- How likely is this new technology to be available for clinical applications? Would it require a technician? I think this can be very helpful to track changes in muscle structures and can help identify if the rehabilitation intervention is working.
References:
- Lieber RL & Fridén J (2019) Muscle contracture and passive mechanics in cerebral palsy. Journal of Applied Physiology 126(5):1492-1501.
- Mathewson MA, Ward SR, Chambers HG, & Lieber RL (2015) High resolution muscle measurements provide insights into equinus contractures in patients with cerebral palsy. Journal of Orthopaedic Research 33(1):33-39.
doi: https://doi.org/10.1242/prelights.23014
Read preprint (No Ratings Yet)
Sign up to customise the site to your preferences and to receive alerts
Register hereAlso in the bioengineering category:
Combinatorial and Inducible CRISPRa/i Enables Canalized hiPSC Forward Programming and Iterative Refinement via Single-Cell Genomics
Cell-ID
Detergent-Triggered Membrane Remodelling Monitored via Intramembrane Fluorescence De-Quenching
Cyntia Alves Conceição, Marcus Oliveira
A Novel Chimeric Antigen Receptor (CAR) - Strategy to Target EGFRVIII-Mutated Glioblastoma Cells via Macrophages
Dina Kabbara
preLists in the bioengineering category:
October in preprints – DevBio & Stem cell biology
Each month, preLighters with expertise across developmental and stem cell biology nominate a few recent developmental and stem cell biology (and related) preprints they’re excited about and explain in a single paragraph why. Short, snappy picks from working scientists — a quick way to spot fresh ideas, bold methods and papers worth reading in full. These preprints can all be found in the October preprint list published on the Node.
| List by | Deevitha Balasubramanian et al. |
CSHL 87th Symposium: Stem Cells
Preprints mentioned by speakers at the #CSHLsymp23
| List by | Alex Eve |
EMBL Synthetic Morphogenesis: From Gene Circuits to Tissue Architecture (2021)
A list of preprints mentioned at the #EESmorphoG virtual meeting in 2021.
| List by | Alex Eve |
3D Gastruloids
A curated list of preprints related to Gastruloids (in vitro models of early development obtained by 3D aggregation of embryonic cells). Updated until July 2021.
| List by | Paul Gerald L. Sanchez and Stefano Vianello |
ASCB EMBO Annual Meeting 2019
A collection of preprints presented at the 2019 ASCB EMBO Meeting in Washington, DC (December 7-11)
| List by | Madhuja Samaddar et al. |
EMBL Seeing is Believing – Imaging the Molecular Processes of Life
Preprints discussed at the 2019 edition of Seeing is Believing, at EMBL Heidelberg from the 9th-12th October 2019
| List by | Dey Lab |
Lung Disease and Regeneration
This preprint list compiles highlights from the field of lung biology.
| List by | Rob Hynds |
Advances in microscopy
This preList highlights exciting unpublished preprint articles describing advances in microscopy with a focus on light-sheet microscopy.
| List by | Stephan Daetwyler |