


Intraspecific variation in thermal tolerance differs between tropical and temperate fishes
Posted on: 9 January 2021
Preprint posted on 7 December 2020
Fanning the flames of climate change: Tropical fish show increased sensitivity to climate warming due to their lack of intraspecific variation in thermal tolerance
Selected by Charlotte NelsonCategories: ecology, evolutionary biology, physiology, zoology
Current climate warming is changing our planet at a pace never previously recorded, and the effects of these rising temperatures are becoming increasingly well documented in many groups of animals and plants. Across the globe we are witnessing range shifts, behavioural and physiological adaptations, and phenological adjustments as species struggle to persist through these novel challenges. Whether these adaptations will prove sufficient is yet to be seen. Until now much work has been focused on whole population level responses, however the importance of intraspecific variation in relation to these changes has been somewhat overlooked. Intraspecific variation (i.e. the scope of variability between individuals of a single species) can be an important metric in how that species is able to cope with any given stressor. When a species has a broad tolerance range among its individuals, its collective sensitivity to the stressor may be reduced (figure 1). The focus of this exciting pre-print is thermal tolerance, clearly a key component of a species’ arsenal in fighting global warming.
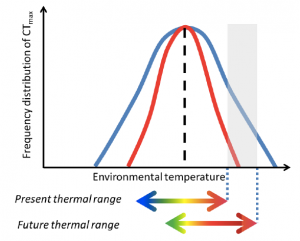
Figure 1: Theoretical illustration showing broad (blue line) and narrow (red line) frequency distribution curves of CTmax.The curves of two species have the same mean CTmax (dashed line) but different standard deviations (S.D.). With ongoing climate change, represented by the shift in the thermal range (double-pointed arrows), individuals of the species with the narrower S.D.CTmax (red curve) are less likely to survive compared to individuals of the species with the wider S.D. CTmax (blue curve), since maximum enviromental temperatures will include values (grey area) outside their thermal tolerance range. (Lifted from Nati, et al).
Nati et al, examine the effect of intraspecific variability on thermal tolerance at a global scale. They use previously published data of critical thermal maximum (CTmax: the temperature above which a fish is unable to maintain equilibrium and will most likely die) to compare the intraspecific variation in thermal tolerance between fish species globally, covering; tropical, temperate, marine, and freshwater ecosystems.
Key findings
The key finding here is that tropical species show reduced intraspecific variation in thermal tolerance than temperate species. Considering that tropical fishes tend to exhibit a smaller overall thermal range and exist closer to their upper thermal limit than their temperate counterparts, this constraint on evolvability to rising temperatures may be another nail in the coffin for tropical species. If this reduced intraspecific variability stems from reduced phenotypic plasticity it will likely increase their sensitivity to warming most significantly in the short term. However, if it corresponds to low heritable genetic variation for thermal tolerance, the effects will be expected to persist over generational time scales. It is not clear at this point which mechanisms may be responsible for the demise of variation in thermal tolerance in tropical species, but in either case, the future does not look bright.
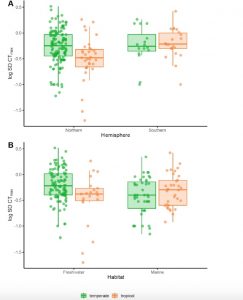
Figure 2: Intraspecific variation in CTmax (log10 transformed standard deviationCTmax) divided into either temperate (148 species) or tropical (55 species). (A)Separated by hemisphere, Northern (132 temperate, 33 tropical species) orSouthern (16 temperate and 22 tropical species). (B) Separated into freshwater (106temperate, 21 tropical species) and marine (42 temperate, 34 tropical species). (Lifted from Nati, et al).
Nati et al, also highlight the significant difference between freshwater and marine species, with marine species showing increased intraspecific variation compared to those from freshwater habitats. Additionally, this work suggests that species inhabiting the Southern hemisphere seem to show reduced intraspecific variability compared to those from Northern latitudes. Clearly there are various interesting aspects to this work that will be exciting avenues for future research.
Why I’m excited about this work
I think this work is really exciting because it highlights an important gap in our approach and understanding of how increasing temperatures impact species at a population level. It clearly indicates the need to include metrics for intraspecific variation in models that project the impacts of warming on fishes. This study exemplifies the importance of considering intraspecific variation when assessing tolerance to environmental stressors and is likely to be relevant to a host of different stressors, organisms, and experimental systems. I’m excited to follow this avenue of research as it progresses!
Open questions
- It is known that polar regions are warming faster than other areas of the world. Do you think this increased rate of warming may ‘even the playing field’ between temperate and tropical species in respect to thermal tolerance and adaptation?
- Why do you think that freshwater species show reduced intraspecific variation in CTmax compared to marine species? Would we not expect freshwater systems to be more thermally variable and so see a greater intraspecific variation in these groups?
- Why did you choose 23 degrees latitude as the cut off for categorising species as temperate or tropical? Surely there are differences in the variation in thermal stability between locations at any latitude – could using some measure of thermal stability be a more informative metric and do you think it would affect your conclusions?
- Southern hemisphere species seem to be acting differently to Northern hemisphere species in your dataset. Could this be a result of the extreme thermal stability caused by the Southern Ocean current?
- You mention several families (e.g. Gobiidae, Blenidae) that have species in both temperate and tropical environments. Are the overall patterns in your data reflected in these groups?
Additional references
Radchuk, V. et al, (2019). Adaptive responses of animals to climate change are most likely insufficient. Nature communications 10, 3109.
Steele, J.H., Brink, K.H., and Scott, B.E. (2019). Comparison of marine and terrestrial ecosystems: suggestions of an evolutionary perspective influenced by environmental variation. ICES Journal of Marine Science, 76 (1),50–59.
doi: https://doi.org/10.1242/prelights.26882
Read preprint (No Ratings Yet)
Charlotte Nelson
I believe figure 2 shows the log standard deviation of the CTmax rather than the CTmax data itself, and hence does display the intraspecific variation within each species which is then grouped by hemisphere or habitat.
Have your say
Sign up to customise the site to your preferences and to receive alerts
Register hereAlso in the ecology category:
Feeding and reproduction of a tropical coastal copepod across warming and copper gradients
Tina Nguyen
Heatwave winners and losers: cryptic coral holobionts differ in thermal tolerance
Maitri Manjunath
No global collapse of food webs across the Permian–Triassic Mass Extinction
Theodora Stougiannou
Also in the evolutionary biology category:
Cell position is more important than cell shape or age for the acquisition of cell identity in the brown alga Ectocarpus
Urvashi Goswami
Inhibition of the gut ceramidase Asah2 decelerates the vertebrate ageing rate
Jeny Jose
Evolutionary landscapes of zygotic genome activation across animals
Panagiotis Giannios
Also in the physiology category:
Inhibition of the gut ceramidase Asah2 decelerates the vertebrate ageing rate
Jeny Jose
Feeding and reproduction of a tropical coastal copepod across warming and copper gradients
Tina Nguyen
Resilience to cardiac aging in Greenland shark Somniosus microcephalus
Theodora Stougiannou
Also in the zoology category:
Behavioral characteristics of an extremely old rhesus macaque in a zoo: Dementia-like symptoms and implications for quality of life of geriatric animals
Stefan Friedrich Wirth
Heatwave winners and losers: cryptic coral holobionts differ in thermal tolerance
Maitri Manjunath
Consciously detecting and recognizing a past visual word after its sensory trace is gone
Maitri Manjunath
preLists in the ecology category:
Developmental regulation: molecular and ecological niches
This conference was held at the Station Biologique de Roscoff (France) and brought together researchers exploring how diverse niche environments shape developmental processes across scales. Spanning topics from ecological and metabolic influences to signalling networks, mechanics and gene regulation, the meeting highlighted the interplay between intrinsic and extrinsic factors in controlling cell fate and tissue organisation. This preList gathers preprints discussed by speakers and poster presenters during the meeting. Please do get in touch at preLights@biologists.com if you notice any relevant preprints that we may have missed.
| List by | Ingrid Tsang |
SciELO preprints – From 2025 onwards
SciELO has become a cornerstone of open, multilingual scholarly communication across Latin America. Its preprint server, SciELO preprints, is expanding the global reach of preprinted research from the region (for more information, see our interview with Carolina Tanigushi). This preList brings together biological, English language SciELO preprints to help readers discover emerging work from the Global South. By highlighting these preprints in one place, we aim to support visibility, encourage early feedback, and showcase the vibrant research communities contributing to SciELO’s open science ecosystem.
| List by | Carolina Tanigushi |
November in preprints – DevBio & Stem cell biology
preLighters with expertise across developmental and stem cell biology have nominated a few developmental and stem cell biology (and related) preprints posted in November they’re excited about and explain in a single paragraph why. Concise preprint highlights, prepared by the preLighter community – a quick way to spot upcoming trends, new methods and fresh ideas.
| List by | Aline Grata et al. |
Biologists @ 100 conference preList
This preList aims to capture all preprints being discussed at the Biologists @100 conference in Liverpool, UK, either as part of the poster sessions or the (flash/short/full-length) talks.
| List by | Reinier Prosee, Jonathan Townson |
preLights peer support – preprints of interest
This is a preprint repository to organise the preprints and preLights covered through the 'preLights peer support' initiative.
| List by | preLights peer support |
EMBO | EMBL Symposium: The organism and its environment
This preList contains preprints discussed during the 'EMBO | EMBL Symposium: The organism and its environment', organised at EMBL Heidelberg, Germany (May 2023).
| List by | Girish Kale |
Bats
A list of preprints dealing with the ecology, evolution and behavior of bats
| List by | Baheerathan Murugavel |
Also in the evolutionary biology category:
SciELO preprints – From 2025 onwards
SciELO has become a cornerstone of open, multilingual scholarly communication across Latin America. Its preprint server, SciELO preprints, is expanding the global reach of preprinted research from the region (for more information, see our interview with Carolina Tanigushi). This preList brings together biological, English language SciELO preprints to help readers discover emerging work from the Global South. By highlighting these preprints in one place, we aim to support visibility, encourage early feedback, and showcase the vibrant research communities contributing to SciELO’s open science ecosystem.
| List by | Carolina Tanigushi |
November in preprints – DevBio & Stem cell biology
preLighters with expertise across developmental and stem cell biology have nominated a few developmental and stem cell biology (and related) preprints posted in November they’re excited about and explain in a single paragraph why. Concise preprint highlights, prepared by the preLighter community – a quick way to spot upcoming trends, new methods and fresh ideas.
| List by | Aline Grata et al. |
October in preprints – DevBio & Stem cell biology
Each month, preLighters with expertise across developmental and stem cell biology nominate a few recent developmental and stem cell biology (and related) preprints they’re excited about and explain in a single paragraph why. Short, snappy picks from working scientists — a quick way to spot fresh ideas, bold methods and papers worth reading in full. These preprints can all be found in the October preprint list published on the Node.
| List by | Deevitha Balasubramanian et al. |
October in preprints – Cell biology edition
Different preLighters, with expertise across cell biology, have worked together to create this preprint reading list for researchers with an interest in cell biology. This month, most picks fall under (1) Cell organelles and organisation, followed by (2) Mechanosignaling and mechanotransduction, (3) Cell cycle and division and (4) Cell migration
| List by | Matthew Davies et al. |
Biologists @ 100 conference preList
This preList aims to capture all preprints being discussed at the Biologists @100 conference in Liverpool, UK, either as part of the poster sessions or the (flash/short/full-length) talks.
| List by | Reinier Prosee, Jonathan Townson |
‘In preprints’ from Development 2022-2023
A list of the preprints featured in Development's 'In preprints' articles between 2022-2023
| List by | Alex Eve, Katherine Brown |
preLights peer support – preprints of interest
This is a preprint repository to organise the preprints and preLights covered through the 'preLights peer support' initiative.
| List by | preLights peer support |
EMBO | EMBL Symposium: The organism and its environment
This preList contains preprints discussed during the 'EMBO | EMBL Symposium: The organism and its environment', organised at EMBL Heidelberg, Germany (May 2023).
| List by | Girish Kale |
9th International Symposium on the Biology of Vertebrate Sex Determination
This preList contains preprints discussed during the 9th International Symposium on the Biology of Vertebrate Sex Determination. This conference was held in Kona, Hawaii from April 17th to 21st 2023.
| List by | Martin Estermann |
EMBL Synthetic Morphogenesis: From Gene Circuits to Tissue Architecture (2021)
A list of preprints mentioned at the #EESmorphoG virtual meeting in 2021.
| List by | Alex Eve |
Planar Cell Polarity – PCP
This preList contains preprints about the latest findings on Planar Cell Polarity (PCP) in various model organisms at the molecular, cellular and tissue levels.
| List by | Ana Dorrego-Rivas |
TAGC 2020
Preprints recently presented at the virtual Allied Genetics Conference, April 22-26, 2020. #TAGC20
| List by | Maiko Kitaoka et al. |
ECFG15 – Fungal biology
Preprints presented at 15th European Conference on Fungal Genetics 17-20 February 2020 Rome
| List by | Hiral Shah |
COVID-19 / SARS-CoV-2 preprints
List of important preprints dealing with the ongoing coronavirus outbreak. See http://covidpreprints.com for additional resources and timeline, and https://connect.biorxiv.org/relate/content/181 for full list of bioRxiv and medRxiv preprints on this topic
| List by | Dey Lab, Zhang-He Goh |
1
SDB 78th Annual Meeting 2019
A curation of the preprints presented at the SDB meeting in Boston, July 26-30 2019. The preList will be updated throughout the duration of the meeting.
| List by | Alex Eve |
Pattern formation during development
The aim of this preList is to integrate results about the mechanisms that govern patterning during development, from genes implicated in the processes to theoritical models of pattern formation in nature.
| List by | Alexa Sadier |
Also in the physiology category:
Developmental regulation: molecular and ecological niches
This conference was held at the Station Biologique de Roscoff (France) and brought together researchers exploring how diverse niche environments shape developmental processes across scales. Spanning topics from ecological and metabolic influences to signalling networks, mechanics and gene regulation, the meeting highlighted the interplay between intrinsic and extrinsic factors in controlling cell fate and tissue organisation. This preList gathers preprints discussed by speakers and poster presenters during the meeting. Please do get in touch at preLights@biologists.com if you notice any relevant preprints that we may have missed.
| List by | Ingrid Tsang |
preLighters’ choice – Handpicked DevBio preprints
preLighters with expertise across developmental and stem cell biology have nominated a few developmental biology (and related) preprints they’re excited about and explain in a few paragraph why. Concise preprint highlights, prepared by the preLighter community – a quick way to spot upcoming trends, new methods and fresh ideas.
| List by | Theodora Stougiannou et al. |
Keystone Symposium on Stem Cell Models in Embryology 2026
The Keystone Symposium on Stem Cell Models in Embryology, 2026, was organised by Jun Wu (UT Southwestern), Jianping Fu (University of Michigan) and Miki Ebisuya (TU Dresden) and held at Asilomar Conference Grounds in California (US). The meeting discussed recent advances made in establishing stem-cell-based embryo models, what fundamental insights into developmental processes have been gleaned from them, as well as how they are beginning to be applied more widely. This prelist contains preprints by presenters at the talk and poster sessions at the conference, which our Reviews Editor in attendance spotted. Please do reach out to preLights@biologists.com if you notice any that we’ve missed.
| List by | Ingrid Tsang |
October in preprints – DevBio & Stem cell biology
Each month, preLighters with expertise across developmental and stem cell biology nominate a few recent developmental and stem cell biology (and related) preprints they’re excited about and explain in a single paragraph why. Short, snappy picks from working scientists — a quick way to spot fresh ideas, bold methods and papers worth reading in full. These preprints can all be found in the October preprint list published on the Node.
| List by | Deevitha Balasubramanian et al. |
Biologists @ 100 conference preList
This preList aims to capture all preprints being discussed at the Biologists @100 conference in Liverpool, UK, either as part of the poster sessions or the (flash/short/full-length) talks.
| List by | Reinier Prosee, Jonathan Townson |
Fibroblasts
The advances in fibroblast biology preList explores the recent discoveries and preprints of the fibroblast world. Get ready to immerse yourself with this list created for fibroblasts aficionados and lovers, and beyond. Here, my goal is to include preprints of fibroblast biology, heterogeneity, fate, extracellular matrix, behavior, topography, single-cell atlases, spatial transcriptomics, and their matrix!
| List by | Osvaldo Contreras |
FENS 2020
A collection of preprints presented during the virtual meeting of the Federation of European Neuroscience Societies (FENS) in 2020
| List by | Ana Dorrego-Rivas |
TAGC 2020
Preprints recently presented at the virtual Allied Genetics Conference, April 22-26, 2020. #TAGC20
| List by | Maiko Kitaoka et al. |
Autophagy
Preprints on autophagy and lysosomal degradation and its role in neurodegeneration and disease. Includes molecular mechanisms, upstream signalling and regulation as well as studies on pharmaceutical interventions to upregulate the process.
| List by | Sandra Malmgren Hill |
Cellular metabolism
A curated list of preprints related to cellular metabolism at Biorxiv by Pablo Ranea Robles from the Prelights community. Special interest on lipid metabolism, peroxisomes and mitochondria.
| List by | Pablo Ranea Robles |
Also in the zoology category:
SciELO preprints – From 2025 onwards
SciELO has become a cornerstone of open, multilingual scholarly communication across Latin America. Its preprint server, SciELO preprints, is expanding the global reach of preprinted research from the region (for more information, see our interview with Carolina Tanigushi). This preList brings together biological, English language SciELO preprints to help readers discover emerging work from the Global South. By highlighting these preprints in one place, we aim to support visibility, encourage early feedback, and showcase the vibrant research communities contributing to SciELO’s open science ecosystem.
| List by | Carolina Tanigushi |
Biologists @ 100 conference preList
This preList aims to capture all preprints being discussed at the Biologists @100 conference in Liverpool, UK, either as part of the poster sessions or the (flash/short/full-length) talks.
| List by | Reinier Prosee, Jonathan Townson |
Bats
A list of preprints dealing with the ecology, evolution and behavior of bats
| List by | Baheerathan Murugavel |
5 years
Marius winther
Figure 2 says: “intraspecific variation”, but the elaborate figure texts describes that your study consists of CTmax data from 148 temperate species and 55 tropical species, and thereby the variation displayed in the box plots showing is not of intraspecific variation( variation within species) but rather interspecific variation (variation between species)? or am I missing some explanation of how you measures the variation? is the 55 tropical species the same species as the 148 species but just originating from temperate regions?